

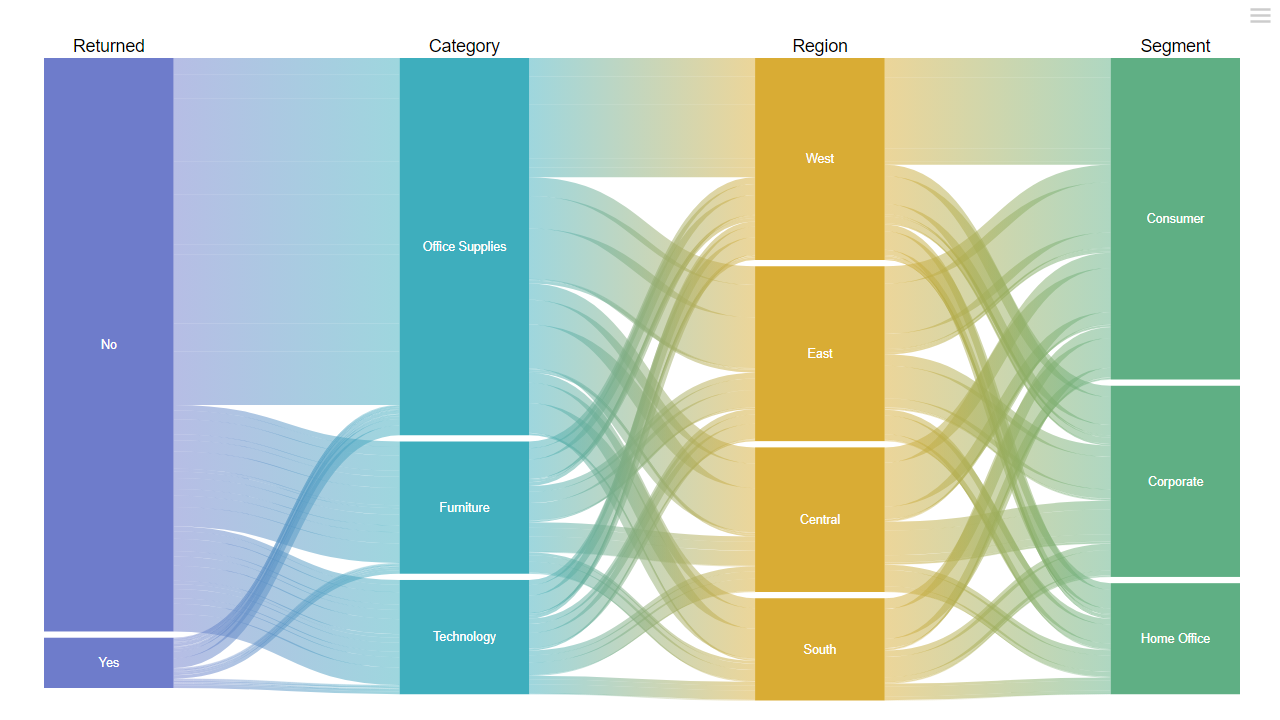
Key Features
- Multi-level flow visualization
- Interactive node and link highlighting
- Customizable node and link colors
Use Cases
- Customer journey mapping
- Process and workflow analysis
- Budget and financial flow tracking
- Website navigation path analysis
Seamless Integration
Fully Integrated with Tableau
Not just a standalone chart — Sankey works as a first-class citizen in your Tableau dashboards with full bi-directional filtering.
Click on a node to filter other sheets in the dashboard
Receive filters from other Tableau sheets to dynamically update displayed flows
Bi-directional dashboard actions for seamless data exploration
Explore Other Extensions
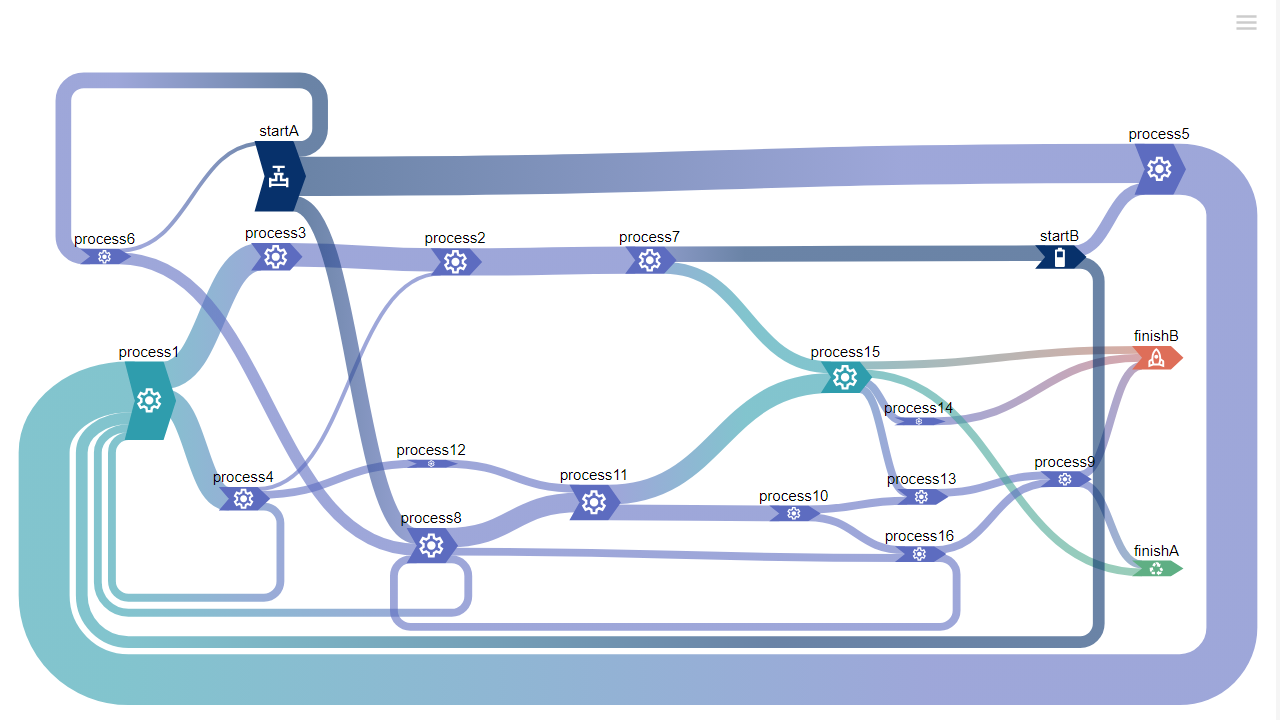
Circular Sankey
Visualize complex flows in a stunning circular layout. Perfect for showing relationships, transfers, and migrations between categories.
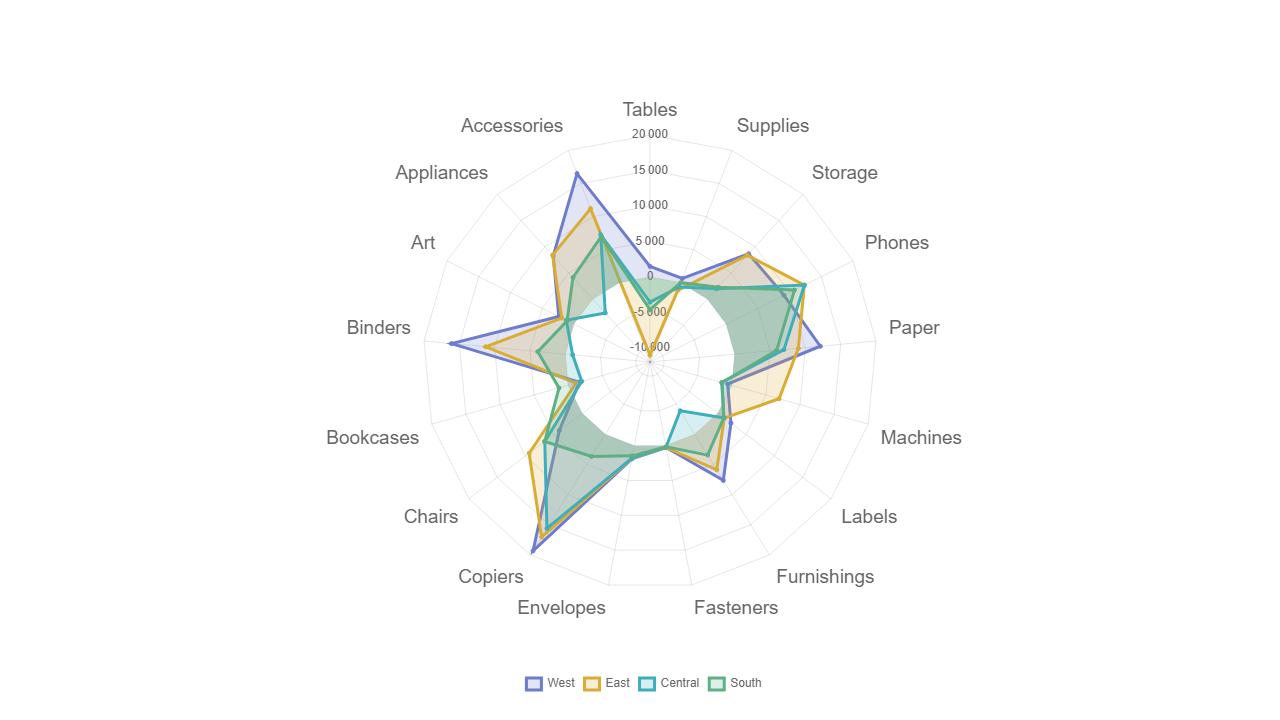
Radar
Multi-dimensional comparison charts for performance profiling, skill assessments, and competitive analysis across many variables.
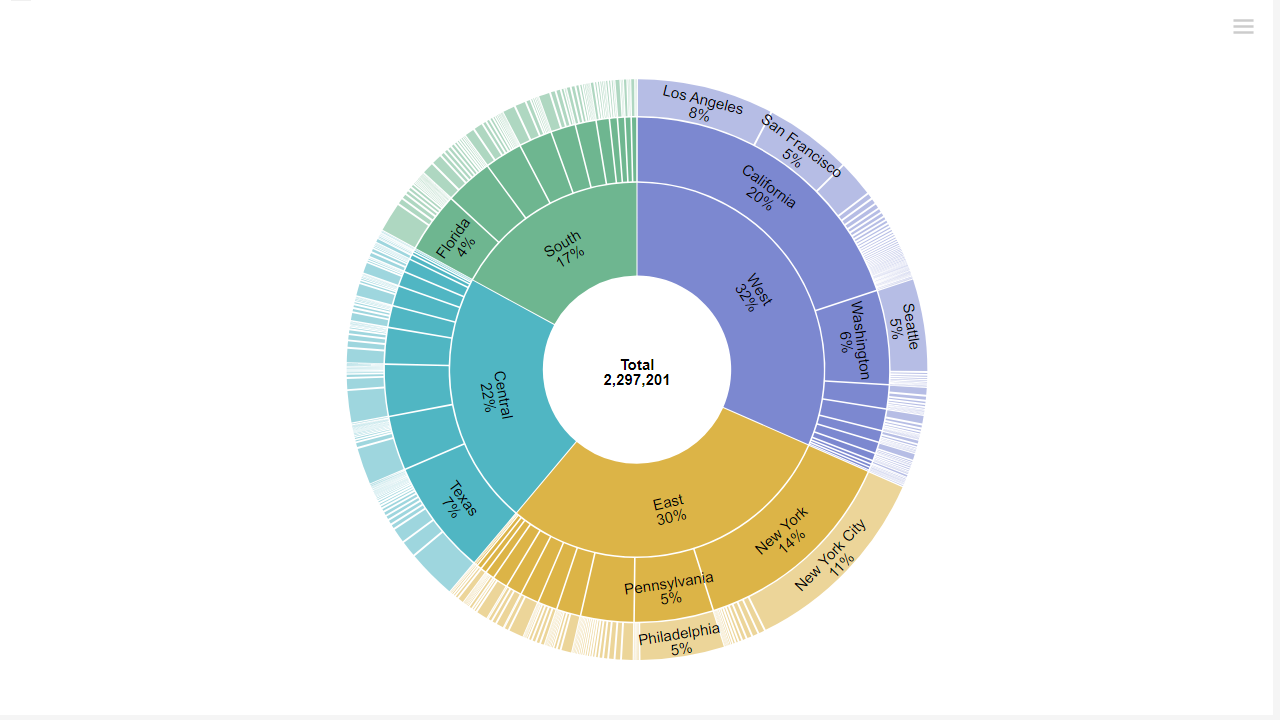
Sunburst
Hierarchical ring charts that reveal part-to-whole relationships across nested categories. Great for org structures and file systems.
Tree
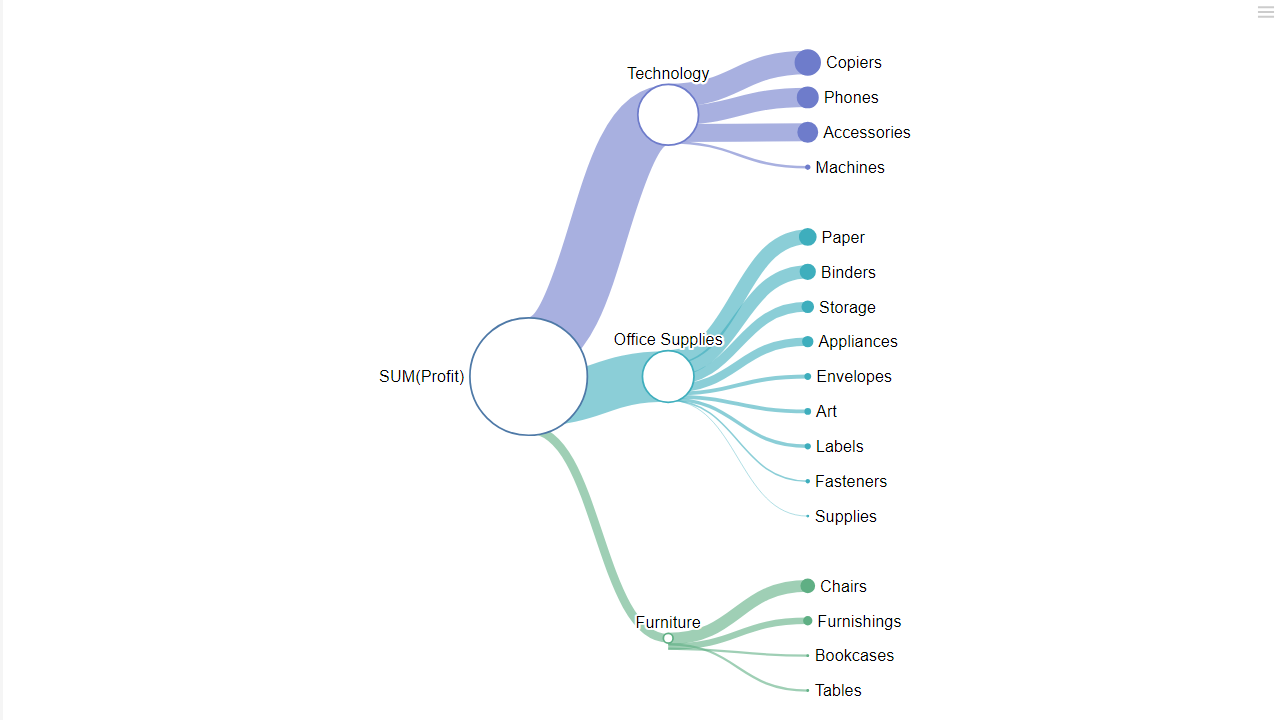
Interactive tree diagrams for exploring hierarchical data — org charts, taxonomies, and decision trees rendered beautifully. Switch to radial mode to unfold your hierarchy in a circular, space-efficient view.